Weather trends for Canebas Weather StationLast update: 25 Mar 2026 1:15 PM |
|||||||||||||
|
|||||||||||||
|
|
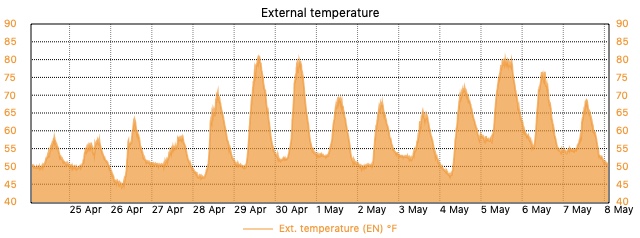 Outside temperature graph for the past 14 days. Temperature sensor is located under a deck for maximum radiation shielding. It is also fan aspirated. |
||||
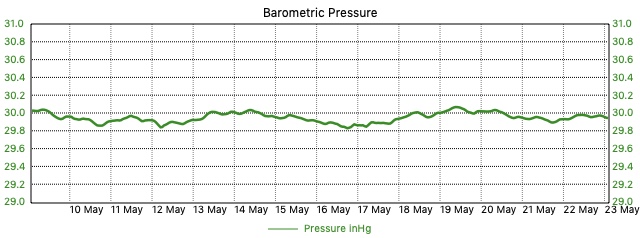 14 day trend of barometric pressure |
||||
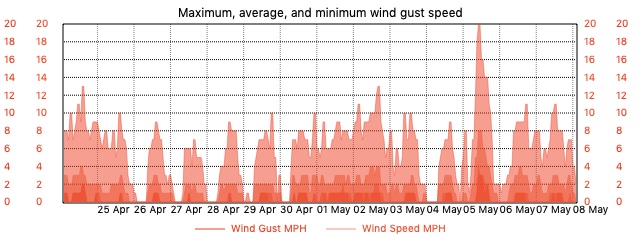 14 day trend of wind gust and average wind speeds |
||||
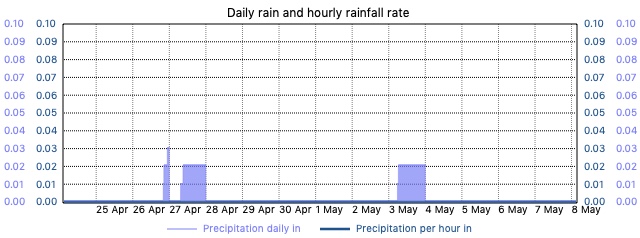 14 day precipitation and hourly rainfall rates |
||||
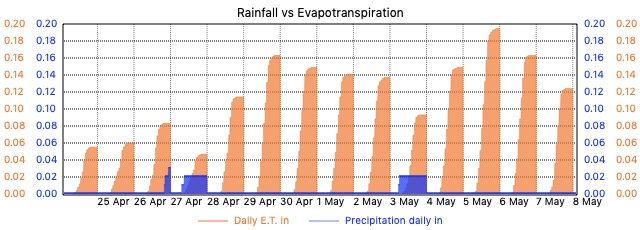 14 day Rainfall vs PenmanñMonteith daily evapotranspiration rates |
||||
|
||||
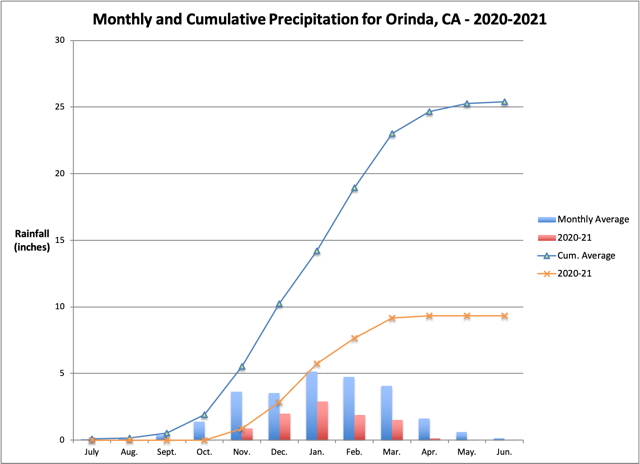
Comparison of observed rainfall at
Canebas weather station with seasonal
averages for Orinda as reported by: idcide.com.
Continuing the trend of this winter,
April's rainfall was a paltry 0.15"
. Assuming, as is likely, that no
more rainfall is received, that would
lave this location with 37% of a normal
season's rainfall. Data is updated
manually. Last update:
May 10, 2021.
|
|